Average Miles Driven Per Year by State [Infographic]
Looking for information about how many miles are driven each year? Americans drive an average of 13,476 miles per year. Check out our complete guide to the average miles driven per year in each state.
Free Car Insurance Comparison
Compare Quotes From Top Companies and Save
Secured with SHA-256 Encryption
Michael Vereecke
Commercial Lines Coverage Specialist
Michael Vereecke is the president of Customers First Insurance Group. He has been a licensed insurance agent for over 13 years. He also carries a Commercial Lines Coverage Specialist (CLCS) Designation, providing him the expertise to spot holes in businesses’ coverage. Since 2009, he has worked with many insurance providers, giving him unique insight into the insurance market, differences in ...
Commercial Lines Coverage Specialist
UPDATED: Jul 5, 2024
It’s all about you. We want to help you make the right coverage choices.
Advertiser Disclosure: We strive to help you make confident auto insurance decisions. Comparison shopping should be easy. We are not affiliated with any one auto insurance provider and cannot guarantee quotes from any single provider.
Our insurance industry partnerships don’t influence our content. Our opinions are our own. To compare quotes from many different companies please enter your ZIP code on this page to use the free quote tool. The more quotes you compare, the more chances to save.
Editorial Guidelines: We are a free online resource for anyone interested in learning more about auto insurance. Our goal is to be an objective, third-party resource for everything auto insurance related. We update our site regularly, and all content is reviewed by auto insurance experts.
UPDATED: Jul 5, 2024
It’s all about you. We want to help you make the right coverage choices.
Advertiser Disclosure: We strive to help you make confident auto insurance decisions. Comparison shopping should be easy. We are not affiliated with any one auto insurance provider and cannot guarantee quotes from any single provider.
Our insurance industry partnerships don’t influence our content. Our opinions are our own. To compare quotes from many different companies please enter your ZIP code on this page to use the free quote tool. The more quotes you compare, the more chances to save.
On This Page
- Americans drive an average of 13,476 miles per year
- States with low population density drive the most
- COVID-19 caused people to drive less than they normally would, impacting overall driving rates.
Due to the massive geographic scale and the urban sprawl of American cities, we have a higher average yearly mileage than anyone else. We drive an average of 13,476 miles per year, which is more than 30% more than our northern neighbors in Canada, who are second with 9,562.1
But how many miles does the average person drive per year?
How do these numbers break down by demographics?
If you have any average annual mileage questions about daily miles that could be put on your new Toyota Prius for the car insurance company or what to expect before you sign your new car lease- you have come to the right place. This infographic will answer all of your burning questions about the average miles driven per year to get the best auto insurance rate.
Our Sourcing and a Note on COVID-19
For the most accurate information, the vast majority of sourcing in this document is pulled from the U.S. Department of Transportation’s Federal Highway Administration Highway Statistics Survey of 2019.
This is the most recent year where a comprehensive study was completed and where driving habits were unaffected by the global pandemic. Naturally, COVID dramatically reduced the number of miles driven in the country. Since the average American became a low mileage driver due to the stay-at-home order, we can expect high mileage for an average driver within the next few years.
Going forward, all driving behavior trends point to the notion that once normal life resumes, the driving mileage will parallel (if not exceed) pre-COVID rates.
Compare over 200 auto insurance companies at once!
Secured with SHA-256 Encryption
What is the average car mileage per year per state?
Americans drive more than any developed nation on earth, covering more than 3 trillion miles per year. But how much they drive depends on the state in which they live. Some states drive less in total on aggregate, but their citizens average more miles per driver.
Additionally, how much they spend on that car mileage varies greatly. For example, the average cost of fuel in California was $4.00, while the average in North Dakota was $2.78 per gallon.
| State | Average Miles Per Driver | Total Miles | Cost of Regular Fuel |
| Alabama | 17,817 | 71 billion | $2.63 |
| Alaska | 11,111 | 5.8 billion | $3.17 |
| Arizona | 13,090 | 70 billion | $3.05 |
| Arkansas | 17,224 | 37 billion | $2.68 |
| California | 12,524 | 340 billion | $4.00 |
| Colorado | 12,899 | 54 billion | $2.96 |
| Connecticut | 12,117 | 31 billion | $2.96 |
| Delaware | 12,609 | 10 billion | $2.75 |
| Florida | 14,557 | 226 billion | $2.79 |
| Georgia | 18,334 | 133 billion | $2.70 |
| Hawaii | 11,688 | 11 billion | $3.77 |
| Idaho | 14,417 | 18 billion | $3.13 |
| Illinois | 12,581 | 107 billion | $3.08 |
| Indiana | 18,024 | 82 billion | $2.79 |
| Iowa | 14,745 | 33 billion | $2.78 |
| Kansas | 14,781 | 31 billion | $2.73 |
| Kentucky | 16,305 | 49 billion | $2.73 |
| Louisiana | 14,951 | 51 billion | $2.60 |
| Maine | 14,215 | 14 billion | $2.83 |
| Maryland | 13,490 | 60 billion | $2.81 |
| Massachusetts | 13,109 | 64 billion | $2.77 |
| Michigan | 14,307 | 102 billion | $2.82 |
| Minnesota | 17,909 | 60 billion | $2.73 |
| Mississippi | 19,966 | 41 billion | $2.57 |
| Missouri | 18,521 | 79 billion | $2.66 |
| Montana | 15,880 | 12 billion | $2.81 |
| Nebraska | 14,846 | 21 billion | $2.81 |
| Nevada | 14,016 | 28 billion | $3.46 |
| New Hampshire | 11,570 | 13 billion | $2.73 |
| New Jersey | 12,263 | 78 billion | $2.92 |
| New Mexico | 19,157 | 27 billion | $2.86 |
| New York | 10,167 | 123 billion | $2.92 |
| North Carolina | 16,073 | 122 billion | $2.63 |
| North Dakota | 17,671 | 9 billion | $2.78 |
| Ohio | 14,278 | 114 billion | $2.81 |
| Oklahoma | 17,699 | 44 billion | $2.66 |
| Oregon | 12,218 | 35 billion | $3.25 |
| Pennsylvania | 11,445 | 102 billion | $3.00 |
| Rhode Island | 9,961 | 7 billion | $2.81 |
| South Carolina | 14,941 | 57 billion | $2.59 |
| South Dakota | 15,541 | 9 billion | $2.85 |
| Tennessee | 15,287 | 82 billion | $2.69 |
| Texas | 16,172 | 288 billion | $2.58 |
| Utah | 15,516 | 32 billion | $3.17 |
| Vermont | 13,004 | 7 billion | $2.81 |
| Virginia | 14,509 | 85 billion | $2.70 |
| Washington | 10,949 | 62 billion | $3.42 |
| West Virginia | 16,876 | 19 billion | $2.78 |
| Wisconsin | 15,442 | 66 billion | $2.73 |
| Wyoming | 24,069 | 10 billion | $2.93 |
States with the Most Driving
Although it’s not always the case, generally speaking, the more sparsely populated a state is, the longer and more frequently a person will need to drive.
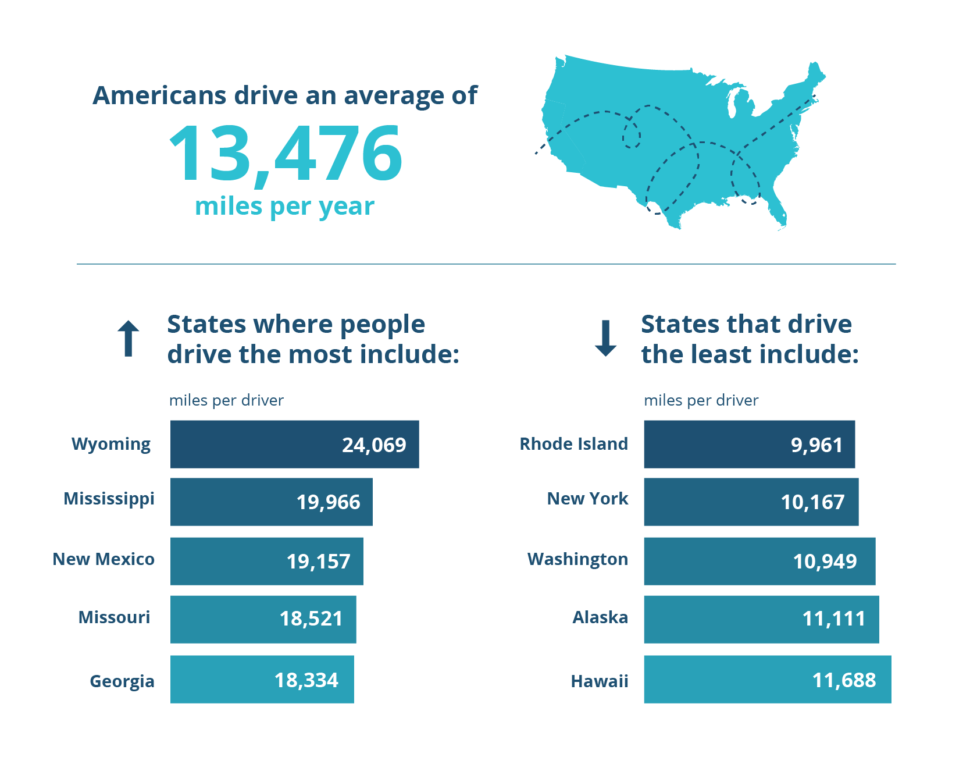
States where people drive the most include:
- Wyoming – 24,069 miles per driver
- Mississippi – 19,966 miles per driver
- New Mexico – 19,157 miles per driver
- Missouri – 18,521 miles per driver
- Georgia – 18,334 miles per driver
These states have a relatively low population density and could be considered rural. States like Wyoming and New Mexico rank amongst the least population-dense states.

States With the Least Driving
Looking to live in a state where low mileage car insurance is the norm? Naturally factors like fuel prices, state geography, and population density impact mileage rates. For instance, many of the largest urban northeastern states along the Acela corridor don’t need to drive as much due to tighter geographic proximity and less urban sprawl. This makes it easier to have and use a public transit system, which reduces the need to drive.
States that drive the least include:
- Rhode Island – 9,961
- New York – 10,167
- Washington – 10,949
- Alaska – 11,111
- Hawaii – 11,688
Looking at these regions, it’s easy to speculate why rates are lower. In places like New York, many citizens in NYC don’t need cars since they live in a large, walkable city with efficient public transit systems. Additionally, in places like Rhode Island and Hawaii, there’s not a lot of space to drive.
Compare over 200 auto insurance companies at once!
Secured with SHA-256 Encryption
Driving By Demographics
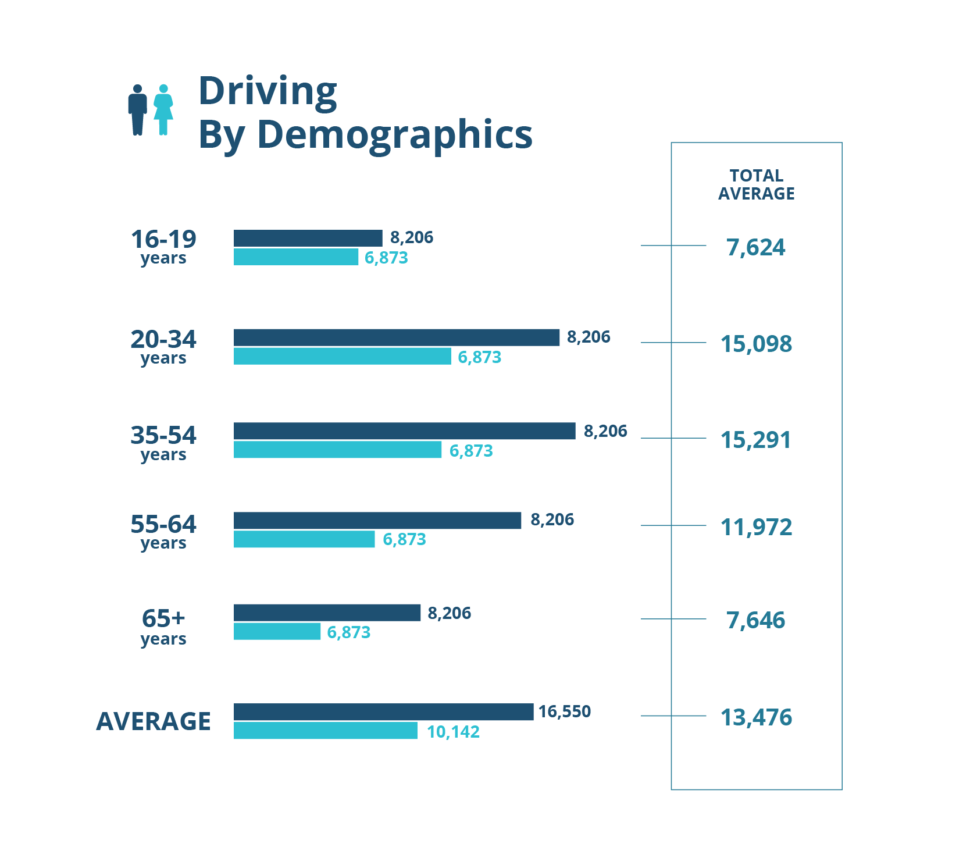
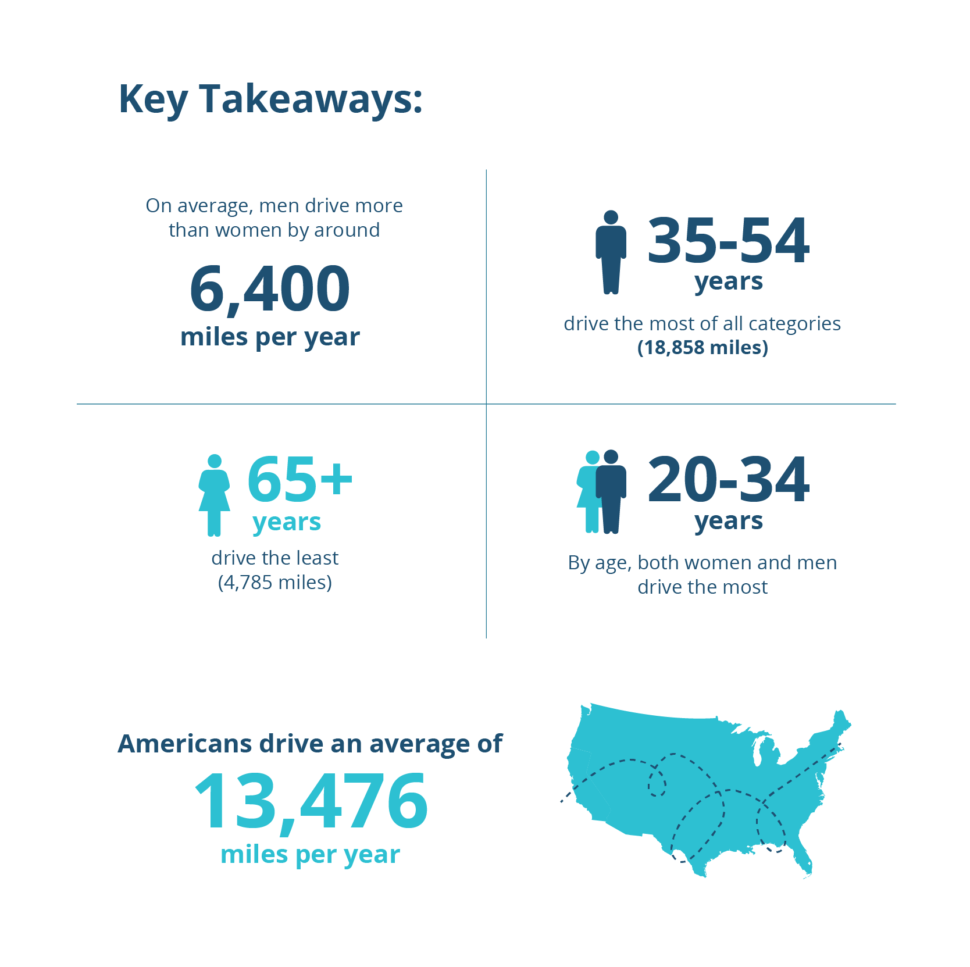
Men and women don’t have the same driving behavior. Additionally, age also impacts how much a person tends to drive. Broken down by age and sex demographics, the average miles driven per American looks like:
| Age | Male | Female | Total Average |
| 16-19 | 8,206 | 6,873 | 7,624 |
| 20-34 | 17,976 | 12,004 | 15,098 |
| 35-54 | 18,858 | 11,464 | 15,291 |
| 55-64 | 15,859 | 7,780 | 11,972 |
| 65+ | 10,304 | 4,785 | 7,646 |
| Average | 16,550 | 10,142 | 13,476 |


COVID’s Impact on Driving Rates
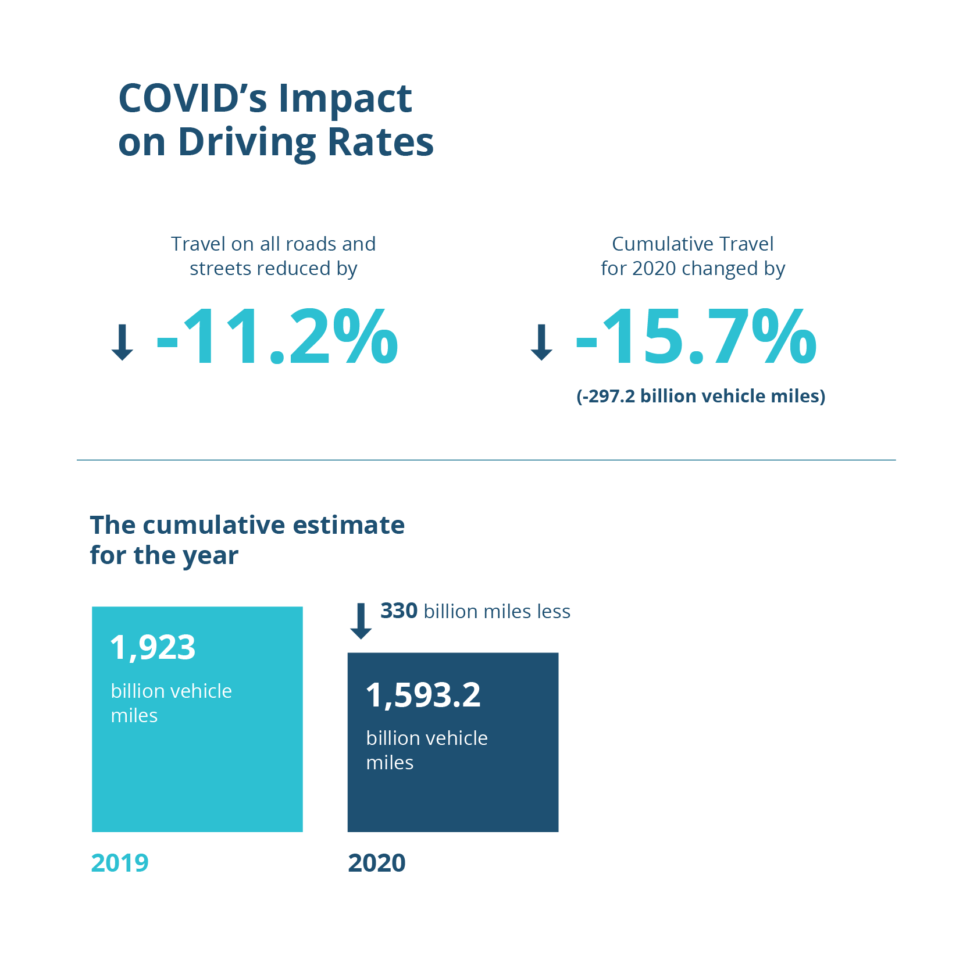
COVID has caused people to drive less frequently than they would in a normal year. Lockdowns and work-from-home orders reduced the frequency of necessary driving as well as vacation driving.
For instance, even in the summer months when lockdowns lax in many states, you can see significant differences across all regions when comparing July 2020 traffic volumes2 with July 2019 volumes:3
- Travel on all roads and streets was reduced by -11.2%
- Cumulative Travel for 2020 changed by -15.7% (-297.2 billion vehicle miles)
- The cumulative estimate for the year is 1,593.2 billion vehicle miles of travel, nearly 330 billion miles less than in 2019.

By region:
| Region | Total travel in billions of miles | Percentage change |
| North-East | 34.9 | -15.4 |
| South-Atlantic | 57 | -11.3 |
| North-Central | 60.0 | -9.7 |
| South-Gulf | 52.7 | -10.8 |
| West | 57.8 | -10.4 |
Additionally, the decrease in traffic caused by emptier roads resulted in a higher frequency of reckless driving, despite the decreased number of car accidents. According to an accident study focused on California:4
- Accident rates across California saw accident reductions as significant as 75%
- Auto accidents caused by speeding had been cut in half
- California Highway Patrol (CHP) saw a 46% increase in tickets issued for drivers speeding at or above 100mph
The fewer cars there were on the road, the more opportunities there were to speed. That said, with states opening up, 2021 will likely have numbers that are closer to 2019 than 2020.
Car Mileage and Car Purchases
If you drive a lot, it’s important to have a reliable car with low-cost car repairs and excellent gas mileage. The impact gas alone can have on your wallet is immense.
Consider a male driver who’s 36 and living in Wyoming:
- In 2019, on average, he drove 24,000 miles per year at $2.93 per gallon.
- If he drove a car that got 20 miles per gallon, he could expect to pay $3,516 in gas.
- However, if his car got 40 miles per gallon, he could pay half that, $1,758 in gas.
- Taken year over year for five years, the cost-savings between the two cars could amount to $8,790 in gas costs alone.
Not to mention, if you drive less, you can likely save money on your car insurance. If you’re someone who plans on having a high driving mileage, it’s critical to consider your car’s gas mileage.
If you would like to compare quotes from other companies, enter your ZIP code into our free tool.
Compare over 200 auto insurance companies at once!
Secured with SHA-256 Encryption
All Your Car Insurance Needs Covered—4AutoInsuranceQuote
Whether you’re looking to compare auto insurance rates or simply educating yourself on all things car insurance-related—you’re in the right place.
4AutoInsurance provides the tools and resources you need to make intelligent decisions regarding your policy. Want to compare quotes from the top insurance agencies in the country? You can do so for free with us. Need more information before you make a decision? Check out more of our resources.
For all your auto insurance needs—4AutoInsurance can help.
Frequently Asked Questions
How many miles does the average person drive per year?
On average, Americans drive 13,476 miles per year, which is more than any other developed nation.
How do the average miles driven per year break down by demographics?
Driving behavior varies based on demographics. Men tend to drive more than women, and age also impacts driving habits. Younger individuals generally drive more than older individuals.
Which states have the highest and lowest average car mileage per year?
States with low population density, such as Wyoming and New Mexico, have higher average car mileage per year. On the other hand, states with denser urban areas like New York and Rhode Island tend to have lower average car mileage per year.
How did COVID-19 impact driving rates?
Due to lockdowns and work-from-home orders, people drove less frequently during the pandemic. However, as restrictions ease, driving rates are expected to return to pre-COVID levels.
How does car mileage affect car insurance rates?
Car mileage can impact car insurance rates. If you drive a lot, it’s important to have a reliable car with good gas mileage and low-cost repairs. Additionally, driving less can often lead to lower car insurance premiums.
How many miles do Americans drive a year?
On average, Americans drive 13,476 miles per year.
Compare over 200 auto insurance companies at once!
Secured with SHA-256 Encryption
Michael Vereecke
Commercial Lines Coverage Specialist
Michael Vereecke is the president of Customers First Insurance Group. He has been a licensed insurance agent for over 13 years. He also carries a Commercial Lines Coverage Specialist (CLCS) Designation, providing him the expertise to spot holes in businesses’ coverage. Since 2009, he has worked with many insurance providers, giving him unique insight into the insurance market, differences in ...
Commercial Lines Coverage Specialist
Editorial Guidelines: We are a free online resource for anyone interested in learning more about auto insurance. Our goal is to be an objective, third-party resource for everything auto insurance related. We update our site regularly, and all content is reviewed by auto insurance experts.


